Additional Information
Model classes and types
This table lists all supported model classes and types in this version of CellOrganizer
| 2D/3D | Model Class | Model Type | Depends on | Produces |
|---|---|---|---|---|
| 2D | vesicle | gmm | nuclear_membrane & cell_membrane | vesicle |
| 2D | nuclear_membrane | medial_axis | N/A | nuclear_membrane |
| 2D | framework | pca | N/A | cell_membrane, nuclear_membrane |
| 2D | cell_membrane | ratio | nuclear_membrane | cell_membrane |
| 3D | vesicle | gmm | nuclear_membrane & cell_membrane | vesicle |
| 3D | nuclear_membrane | cylindrical_surface | N/A | nuclear_membrane |
| 3D | cell_membrane | ratio | nuclear_membrane | cell_membrane |
| 2D | framework | diffeomorphic | N/A | cell_membrane, nuclear_membrane |
| 3D | framework | diffeomorphic | N/A | cell_membrane, nuclear_membrane |
| 3D | network | microtubule_growth | nuclear_membrane & cell_membrane | microtubule |
| 3D | protein_distribution | morphing | N/A | protein spatial distribution |
| 3D | standardized_voxels | standardized_map_half-ellipsoid | N/A | N/A |
| 3D | csgo | half-ellipsoid | N/A | N/A |
Reproducing Figures from Research Articles
This table is a guide to specific demos included with CellOrganizer that generate figures similar to those presented in publications that used CellOrganizer to analyze particular datasets. Some demos will generate the same figures as in the research article and others will build a similar output, e.g. same figure different synthetic image.
| Article | Figure 1 | Figure 2 | Figure 3 | Figure 4 | Figure 5 | Figure 6 | Figure 7 | Figure 8 | Figure 9 | Figure 10 |
|---|---|---|---|---|---|---|---|---|---|---|
| Johnson et a. (2105) | N/A | demo3D27 | N/A | N/A | N/A | N/A | N/A | N/A | N/A | N/A |
| Li et al. (2012) | N/A | demo3D00, demo3D02 | N/A | demo3D04 | demo3D35 | N/A | N/A | N/A | N/A | N/A |
| Buck et al. (2012) | demo2D01 | demo3D11 | N/A | demo2D02, demo3D09 | N/A | demo3D04 | N/A | N/A | N/A | N/A |
| Murphy (2012) | demo2D01 | demo3D11 | N/A | N/A | N/A | N/A | N/A | N/A | N/A | N/A |
| Peng and Murphy (2011) | demo3D11 | N/A | N/A | N/A | N/A | N/A | N/A | demo3D02 | N/A | N/A |
| Shariff et al (2011) | demo3D04 | demo3D04 | N/A | N/A | N/A | N/A | N/A | N/A | N/A | N/A |
| Murphy (2010) | N/A | N/A | N/A | demo3D01 | N/A | demo2D00 | N/A | N/A | N/A | N/A |
| Shariff et al. (2010) | demo3D01, demo3D14 | N/A | N/A | demo3D07, demo3D06 | N/A | demo3D35 | demo3D35 | demo3D35 | N/A | N/A |
| Peng et al. (2009) | N/A | demo2D04, demo3D15, demo3D20 | N/A | N/A | demo3D15 | N/A | N/A | N/A | N/A | N/A |
OME-TIFF
The software supports saving synthetic images as valid OME.TIFF. Currently, the software can only save images with one protein pattern as OME.TIFFs. To do this, use the output flag
options.output.OMETIFF = true;
For an example, investigate and run demo3D34.
SBML Spatial Level 3
The software supports saving synthetic images as valid SBML Level 3 Spatial instances. Currently, the software can only save images with one vesicle pattern as OME.TIFFs. To do this, use the output flag
options.output.SBMLSpatial = true;
For an example, investigate and run demo3D34.
T cell models
Overview
The T Cell model is a building model for 3D cells with protein patterns, and can be used to develop 4D movies. The model is based on the T cell model in Royal et al. 2016. We assume different cells have similar cell shape and can be mapped to a template. This lends the model to be useful for quantitative analysis of proteins in T cells, as well as other cells. Similar to other models in CellOrganizer, there are two parts: training and synthesis. In training, a morphing model is trained from the original images. In synthesis, images of cells are synthesized from the trained model and include the protein pattern.
We have a protocol chapter that describes how the images are generated, annotated and analysized:
- Ambler, R., Ruan, X., Murphy, R. F. and Wülfing, C., 2017. Systems Imaging of the Immune Synapse. The Immune Synapse: Methods and Protocols, pp.409-421.
The usage of the model is part of the chapter (section 3.7 & 3.8)
Training
The training part requries T cell movies and the annotation of the synapse positions of the T cells as input. It can be further broken down into the following steps: cropping, segmentation, rigid alignment, non-rigid alignment (morphing) and model-building.
The training demo included, demo3Dtcell_train, trains a protein distribution model following the approach described in
- Roybal, T. E. Buck, X. Ruan, B. H. Cho, D. J. Clark, R. Ambler, H. M. Tunbridge, J. Zhang, P. Verkade, C. Wülfing, and R. F. Murphy (2016) Computational spatiotemporal analysis identifies WAVE2 and Cofilin as joint regulators of costimulation-mediated T cell actin dynamics. Science Signaling 9:rs3. doi: 10.1126/scisignal.aad4149.
The slowest step, which takes approximately 1 min per cell per frame, is the alignment of each cell to the standardized template. This demo uses 46 cells, so it will run for about an 1 hour on a single core.
Synthesis
In the synthesis part, a T cell model is required as input. Should there be a specified shape to the cells, then a cell shape model is also required. The synthesis can be further broken down into the following steps: voxel sampling, shape registration, and voxel mapping.
The synthesis demo included, demo3Dtcell_synth, sythesizes from a T cell model. The demo takes in two models, one model containing the cell and nuclear shape models, and the other containing a T cell protein shape model.
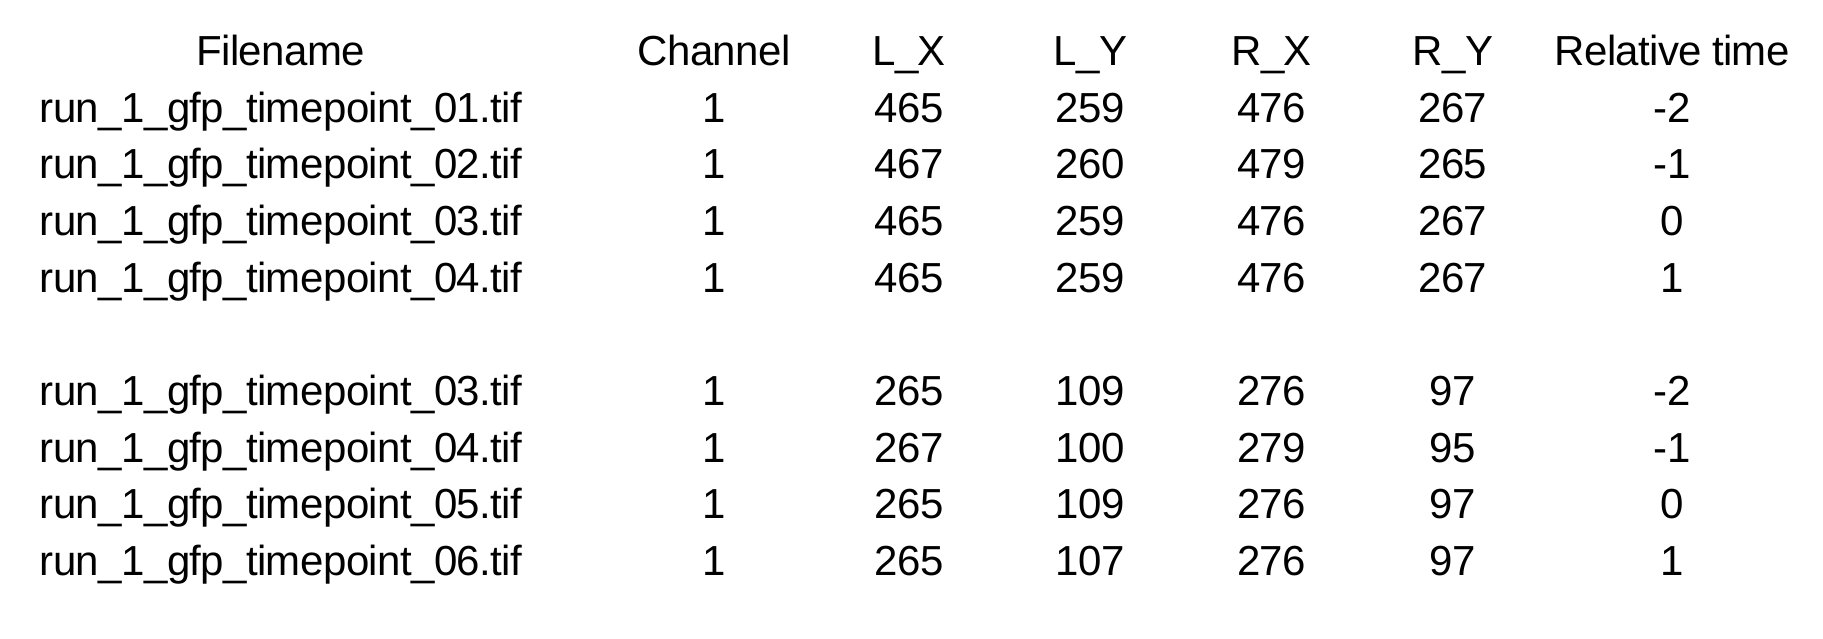
Annotation File
Each annotation file contains the information of chosen cell pairs for a movie (each frame is a 3D stack). An example annotation file is shown below. The annotation file should be formated as described below:
- Each row represents a cell in a specific time point. And the adjacent rows without blank row separation represents a cell in different time points. Different cells are separated with blank row(s).
- In column 1, the name of the image file (depending on how the images are acquired, there may be one file per time point or multiple time points in a single file).
- In column 2, the number of the channel within that file that contains the GFP fluorescence for that time point (if each time point is in a separate file, this would typically be channel 1; if multiple time points are in the same file, this would typically be the frame number).
- In columns 3–7, the X coordinate of the left end point, the Y coordinate of the left end point, the X coordinate of the right end point, and the Y coordinate of the right end point for the synapse in that time point.
- In column 8, the time difference for that frame relative to time point 0.